Service Area – Mile After Rugged Mile
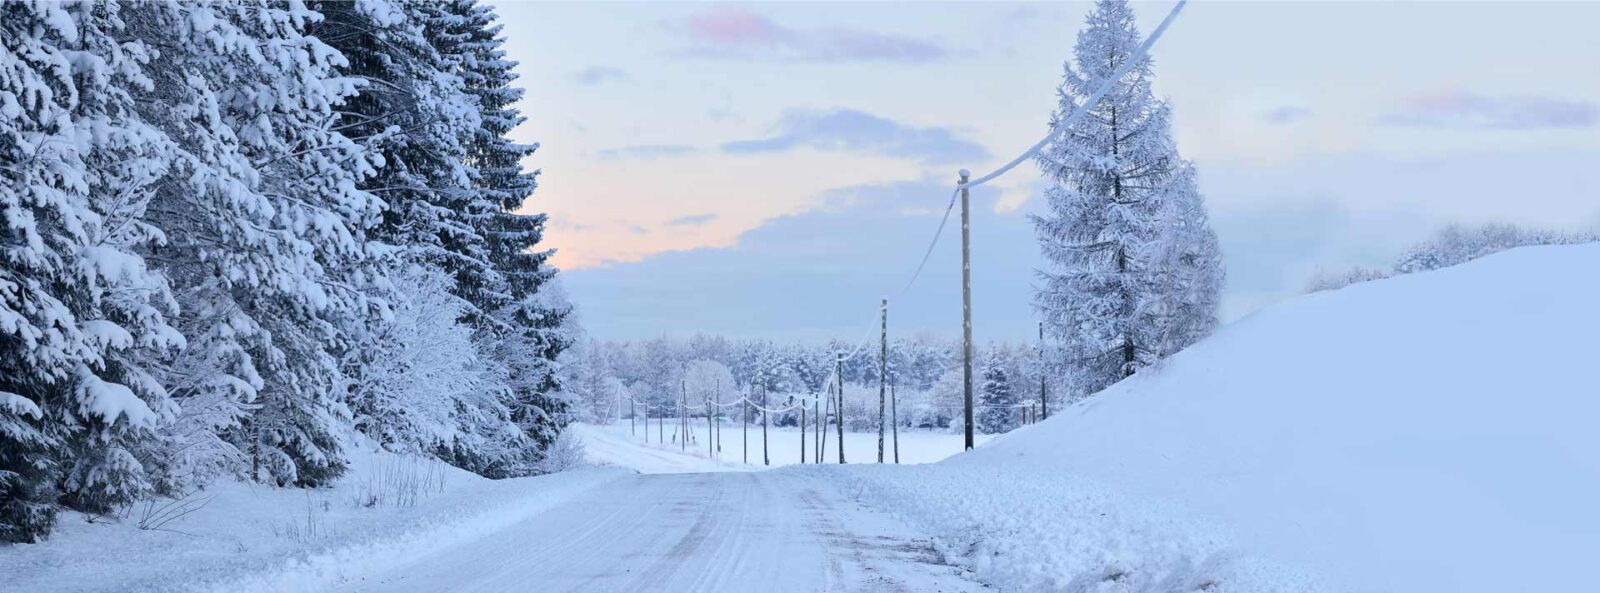
UPPCO brings you power through one of the most rural, weather-challenged areas in America.
Unlike power companies in more populated areas, UPPCO customers are spread out over nearly 4,460 square miles in Upper Michigan – much of it heavily forested. On average, UPPCO has 12 customers per square mile.
Despite the rugged terrain and the U.P’s average annual snowfall of 200 inches, UPPCO excels at providing customers with dependable service and safe, reliable energy.
Service Overview
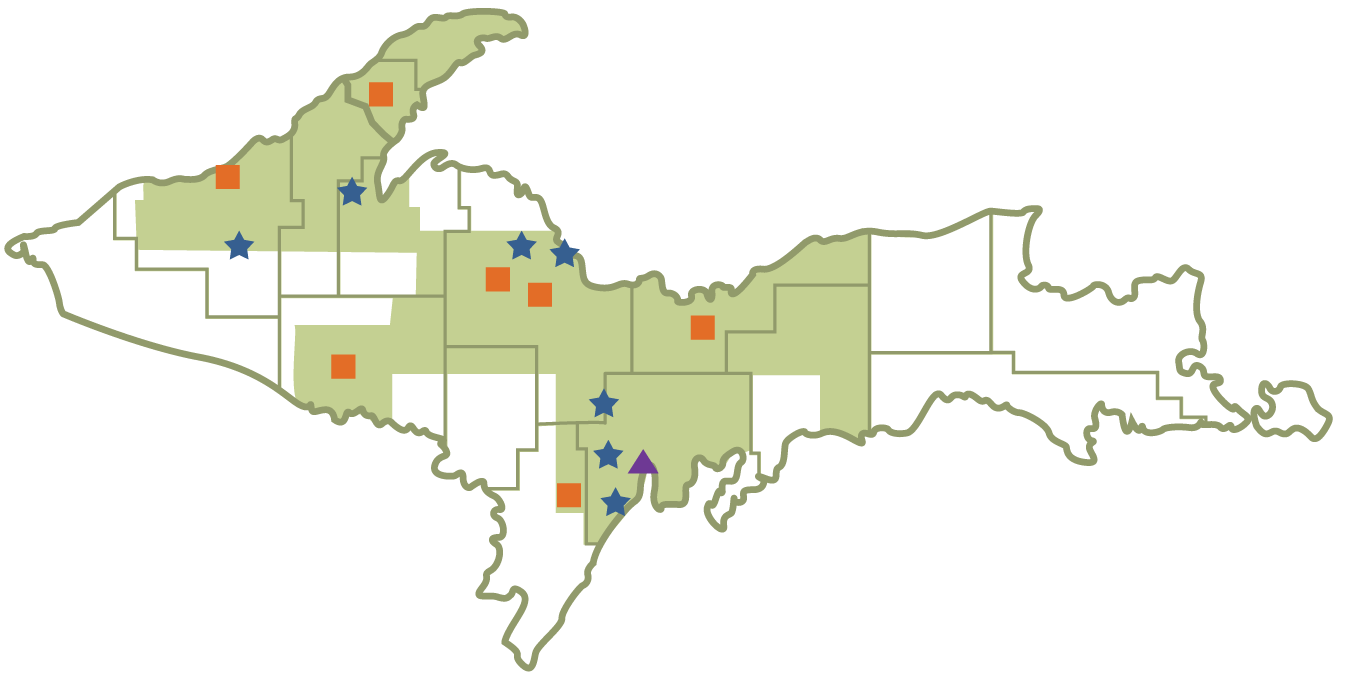
- 10 Upper Peninsula counties
- 4,460 square miles of service area
- 52,000 customers
- 7 hydroelectric generation stations
- 1 combustion turbine
- 58 power substations
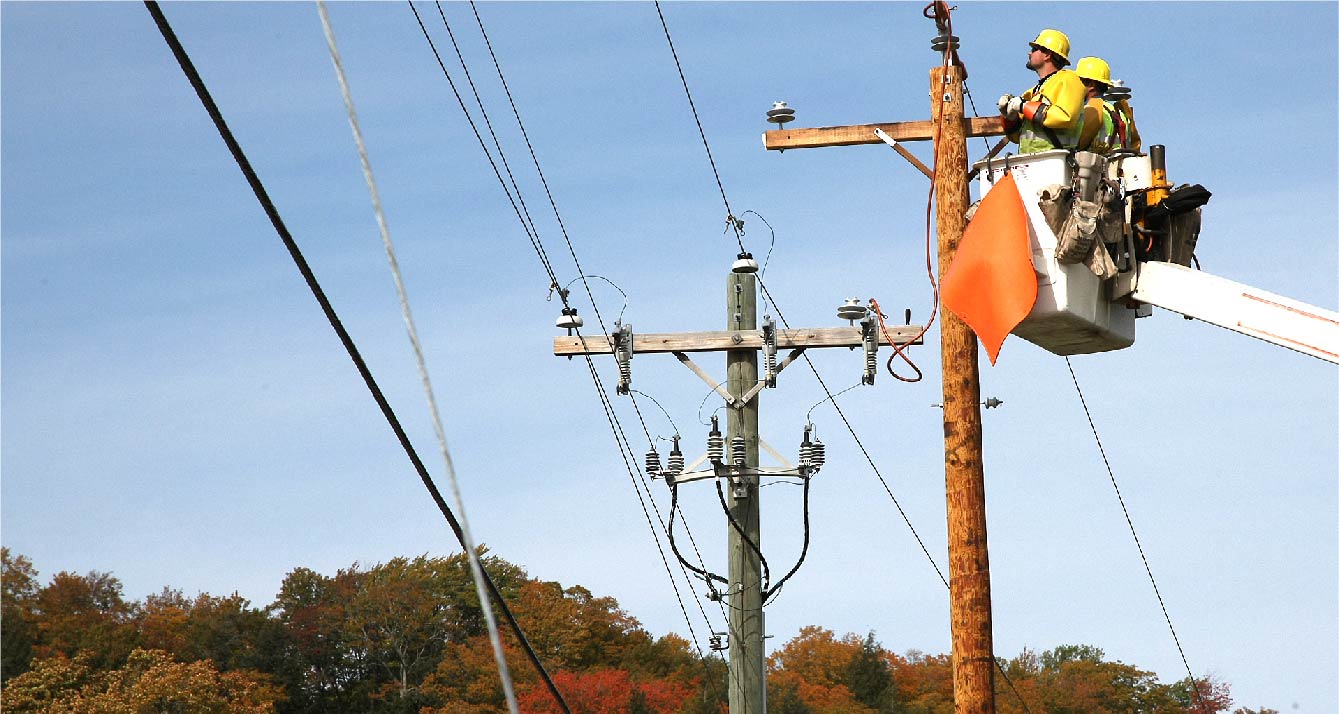
- 4,468 miles of power lines
UPPCO purchases a majority of the power our customers use on the MISO (Midcontinent Independent System Operator) market.
Round-the-Clock Operations
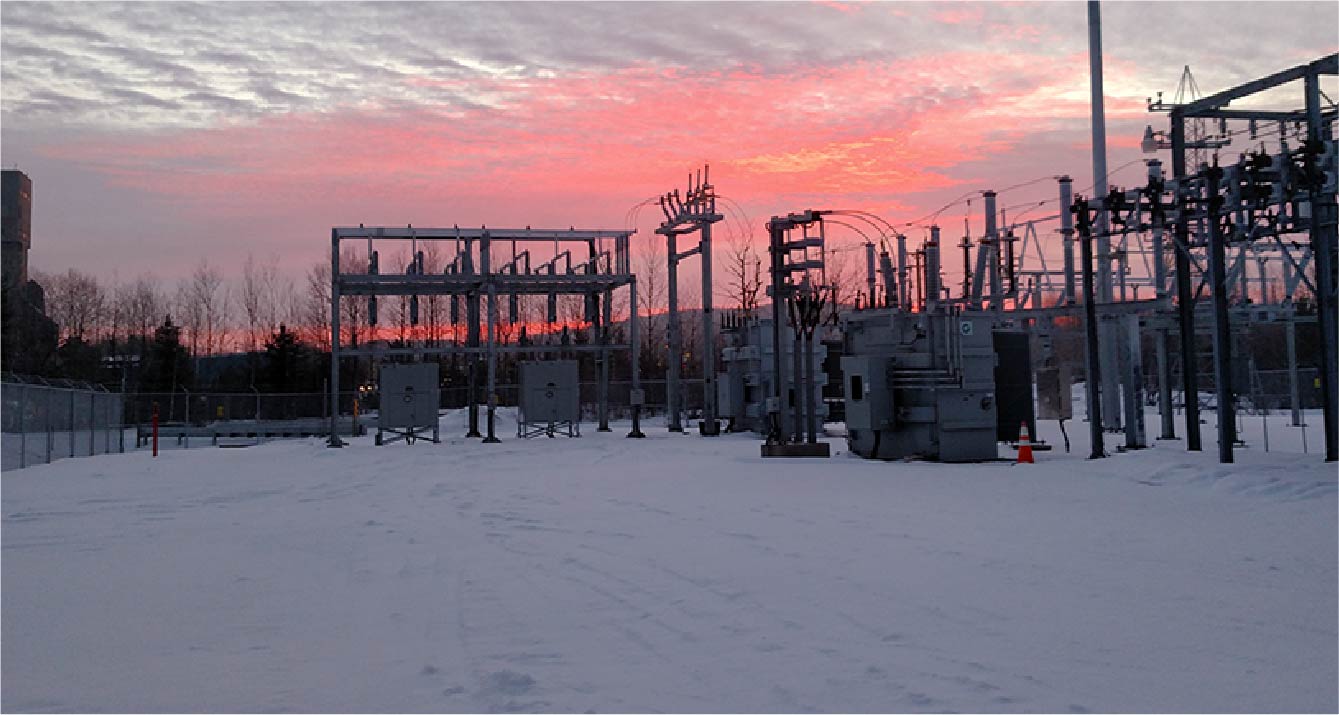
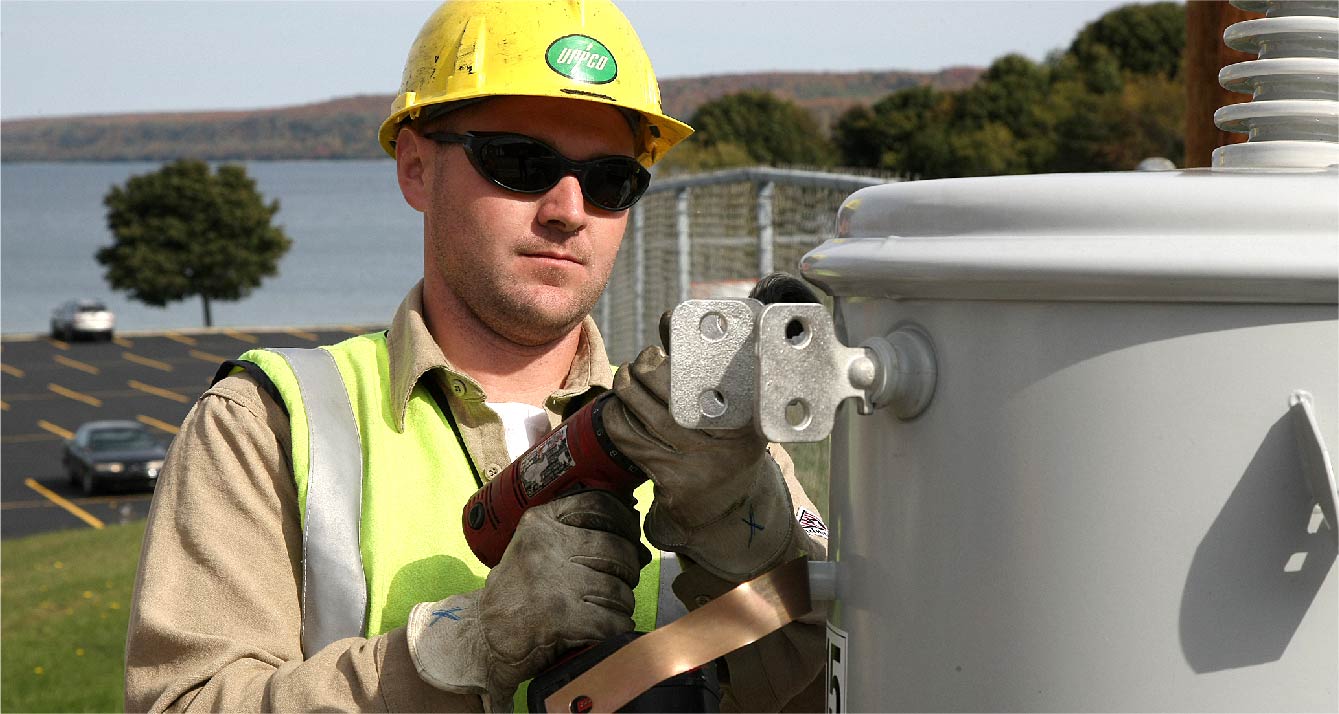
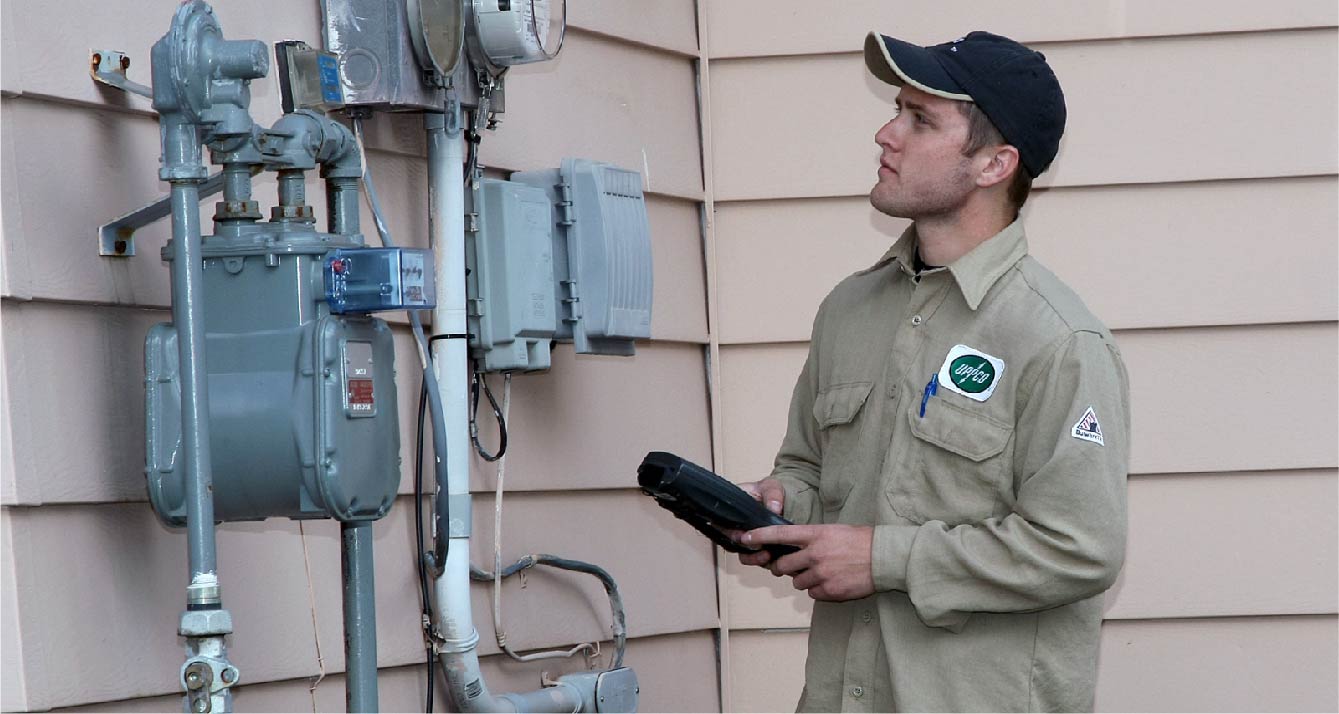
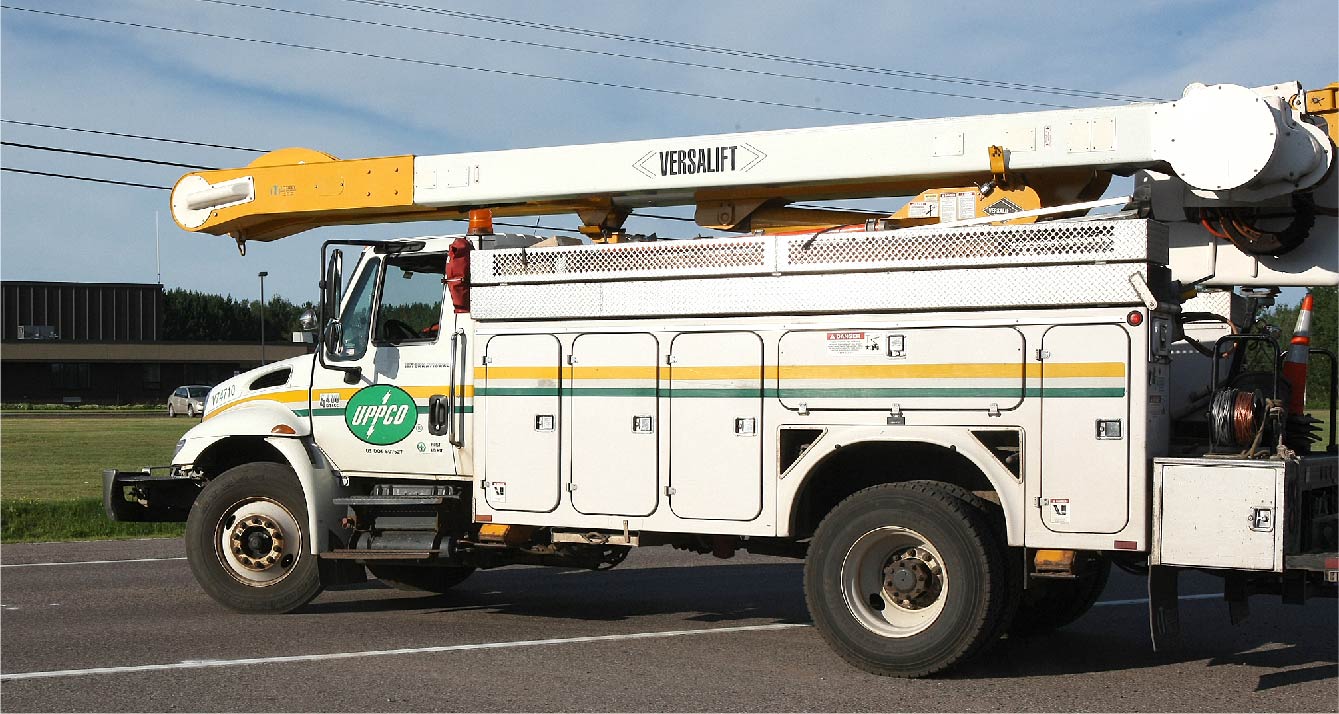
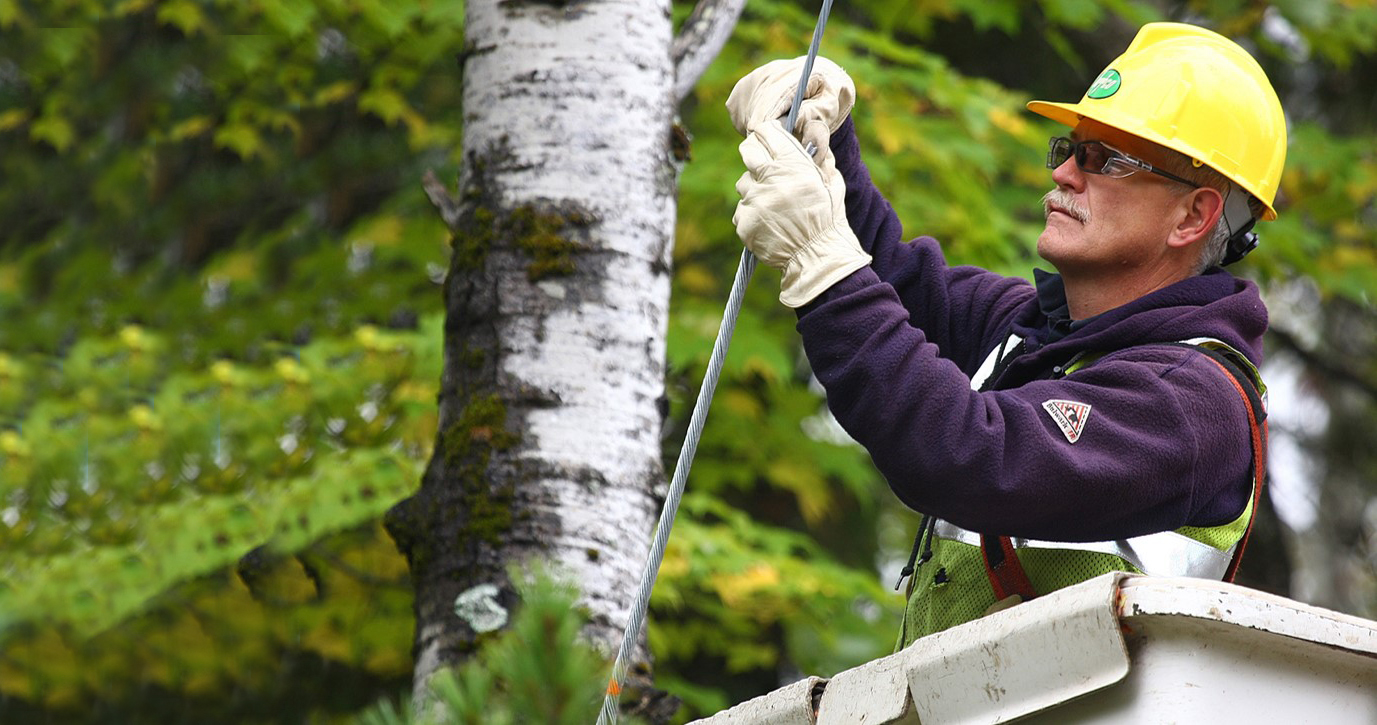
UPPCO’s grid system network is comprehensive and integrated to manage, distribute, and service our community electricity needs.
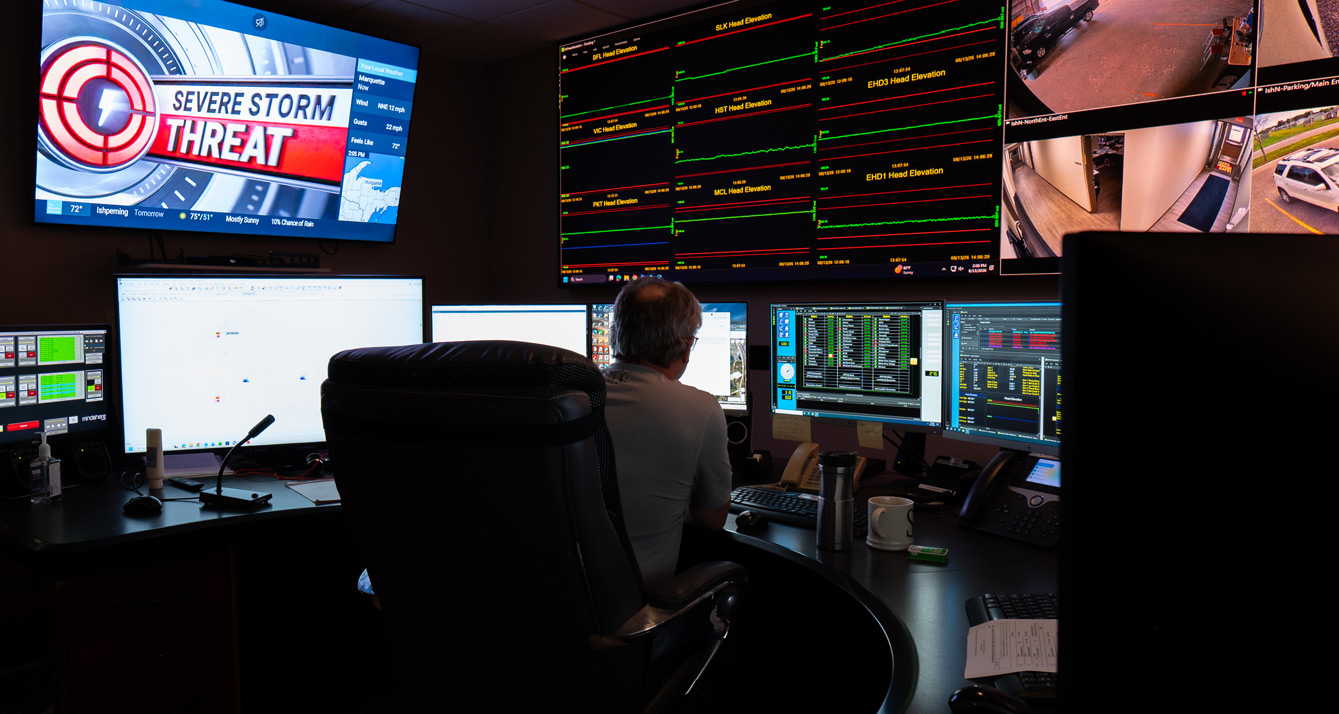
UPPCO works every minute, every day, to reliably and safely deliver electricity to you. UPPCO’s state-of-the-art system operations and dispatch center becomes aware if an interruption occurs and expedites service restoration at the fastest, safest speeds.
Visit Outage CenterIntegrated Grid System Network

Generating Much More Than Electricity
UPPCO Hydroelectric facilities bring considerable value to our customers and the Upper Peninsula.
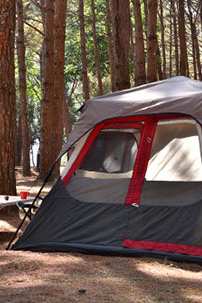
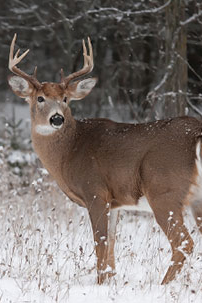
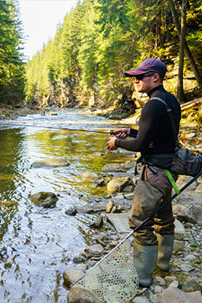
UPPCO’s hydroelectric facilities are good for our community and the environment we live in. They offer recreational opportunities on land and water, as well as help to support local tax bases. Programs and services are provided to the public and schools, jobs are generated for the operation and maintenance of the facilities, plus fish and wildlife habitats are created.
Hydropower is “always generating” compared to other types of renewable energy. There are no waste or fuel storage issues with hydroelectric power. Hydropower is a renewable, clean, safe, reliable, and flexible way to generate electricity.
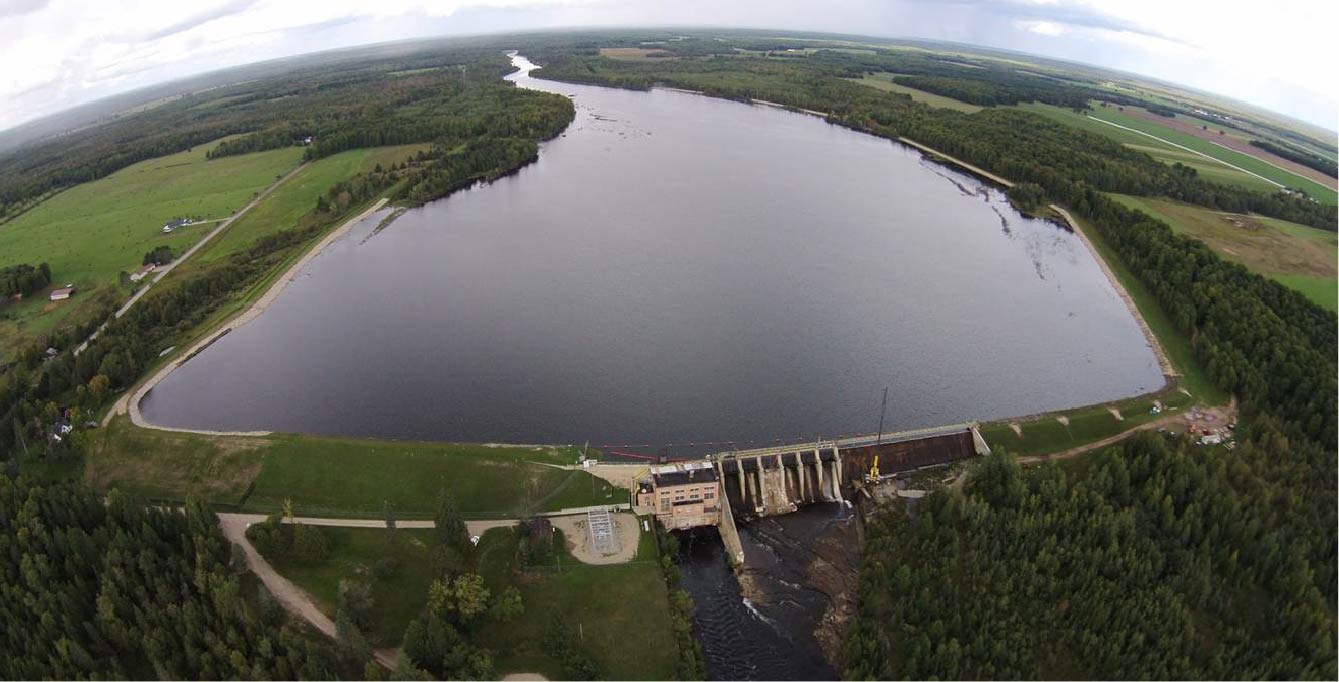
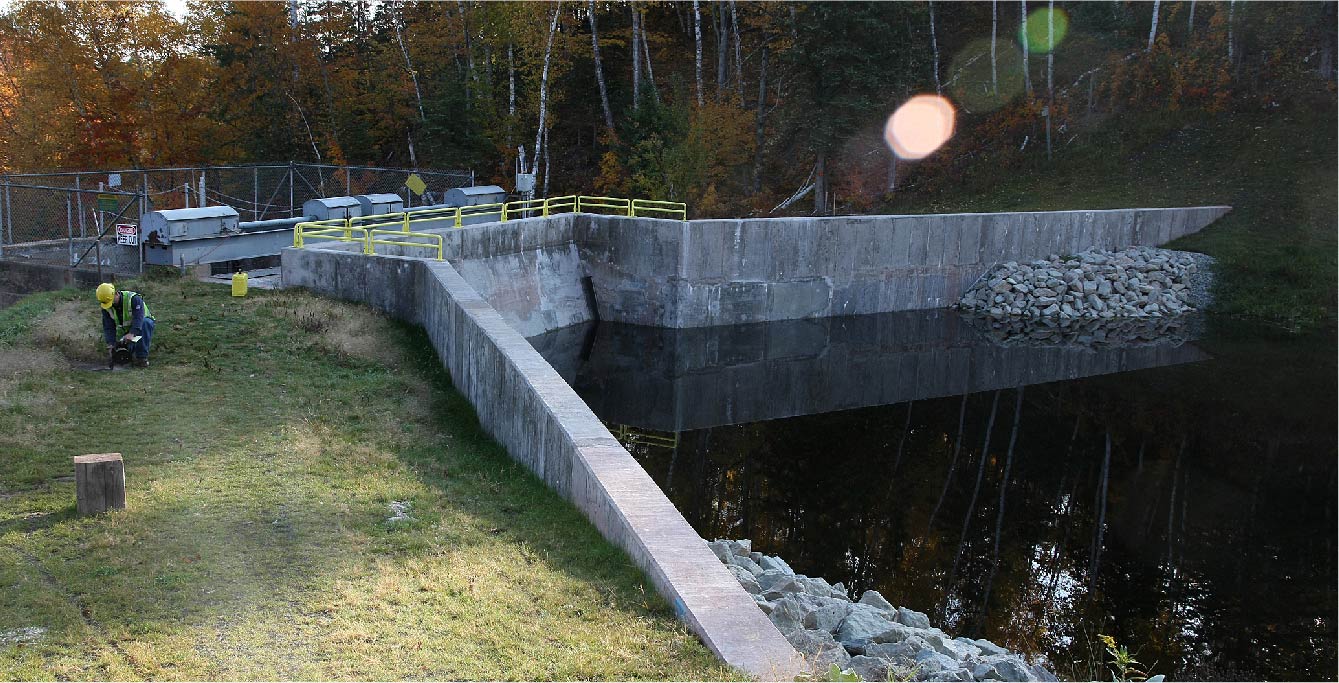
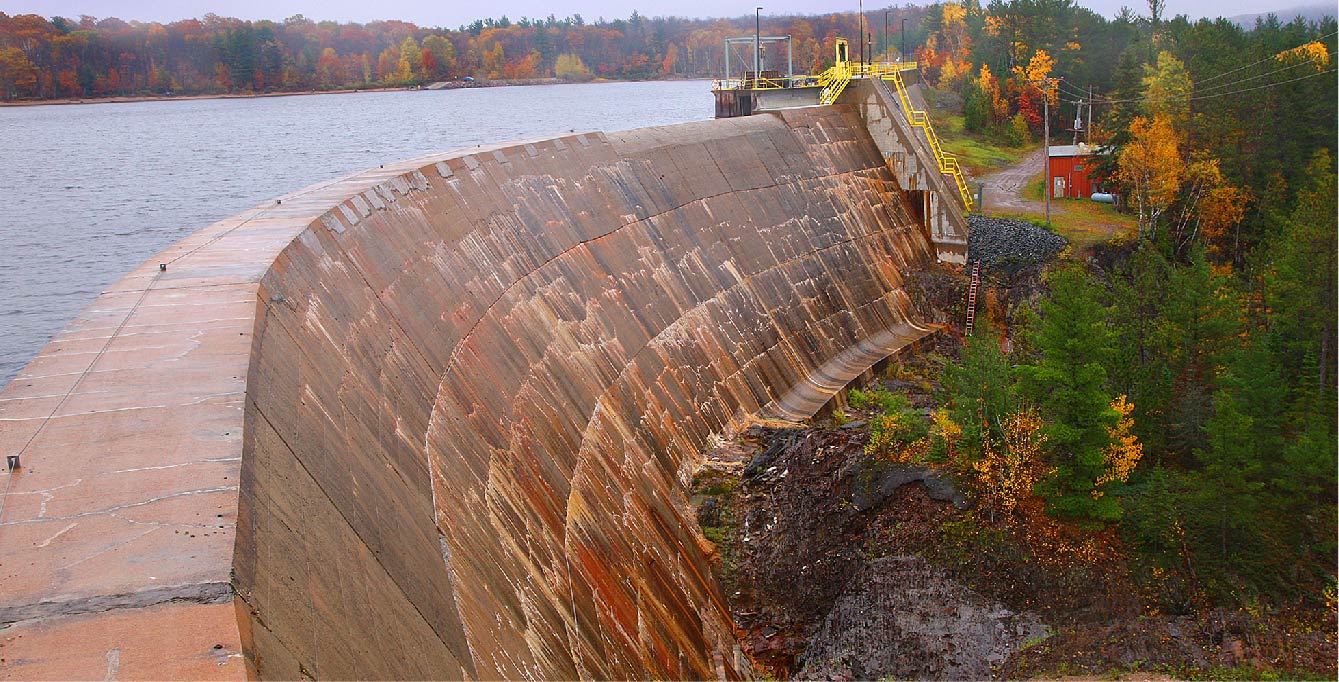
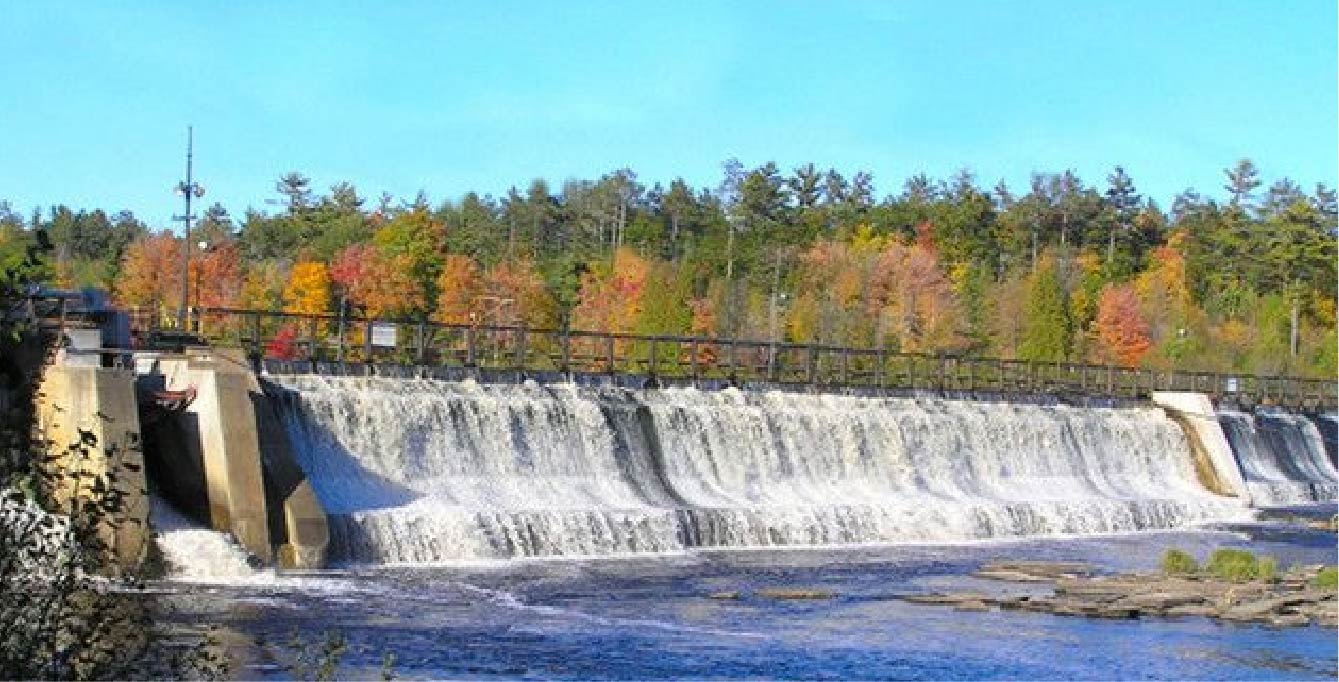
We currently own and operate seven hydroelectric dam sites that produce renewable energy and 4 water storage reservoirs. Our continued investments to maintain their performance keep these facilities strong and safe.
Hydro Water LevelsHydroelectric Community Benefits


UPPCO Hydroelectric Sites
How Hydroelectric Works
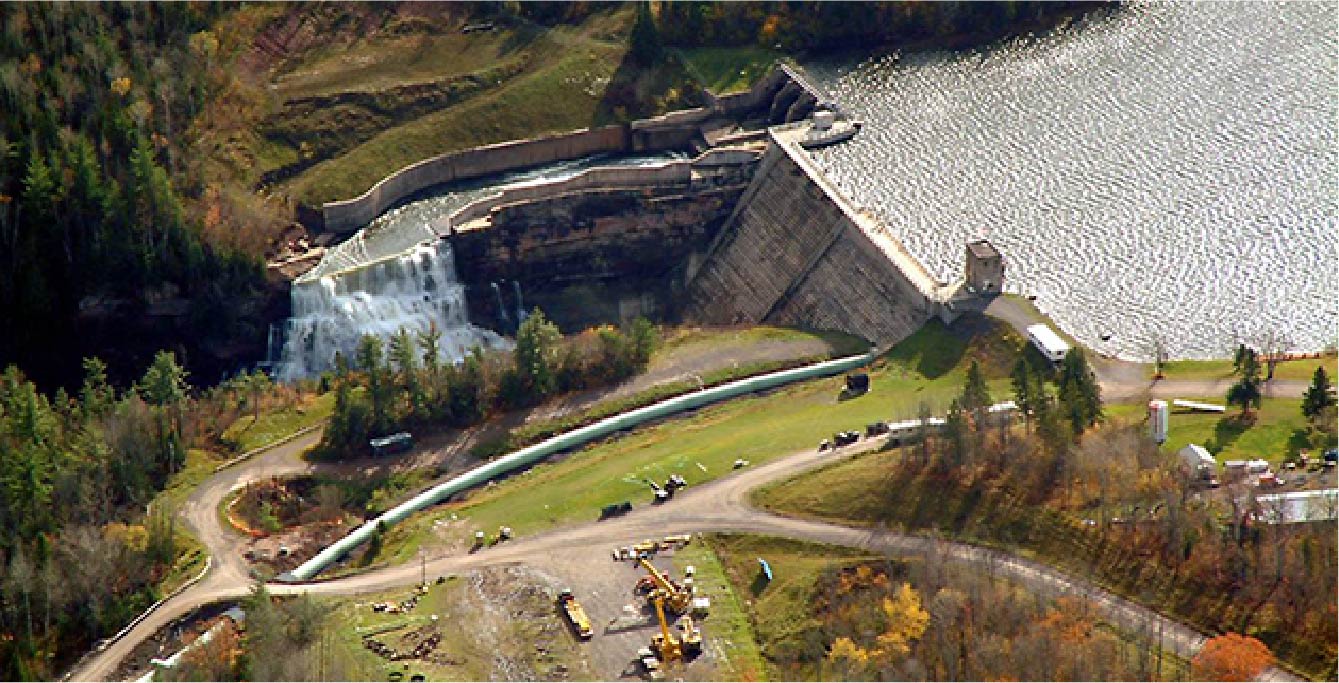
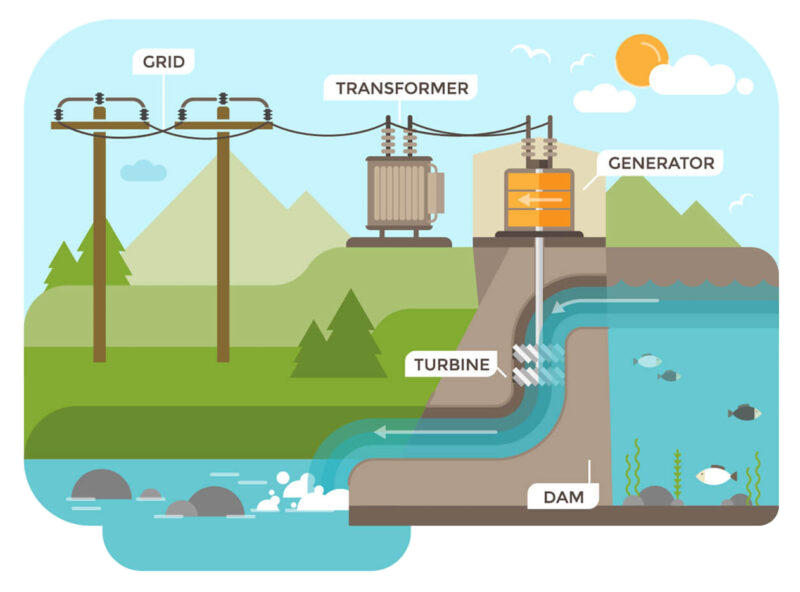
Hydro power plants harness the energy of falling water to make electricity. A dam backs up the water, creating a deep reservoir and a higher fall of water. In other words, the reservoir is a form of stored energy. When the water is released, its force turns a turbine. The turbine turns a generator, where electricity is produced.
Environmental Efforts
UPPCO makes a conscious effort to support our environment in several ways. We feel our actions will always speak louder than words.
Supporting Local Fish Populations
Lake Sturgeon Trailer
In 2012, we were approached by the U.S. Fish and Wildlife Service to put a lake sturgeon streamside rearing trailer on UPPCO property near the Bergland Dam. They also requested to withdraw water from Lake Gogebic. The purpose of the trailer is to raise lake sturgeon in water from the Ontonagon River watershed. Lake sturgeon raised in water from a specific watershed are “imprinted” with that watershed.
First, eggs are harvested by the U.S. Fish and Wildlife Service from lake sturgeon netted below UPPCO’s Prickett Dam. Then the eggs are fertilized. The fertilized eggs are placed in tanks in the trailer. Fresh water is pumped from the river and passed through the tanks while the larvae and fingerlings are fed and allowed to grow.
Once the lake sturgeon become about 5 to 8 inches in length, the U.S. Fish and Wildlife Service releases them into the Ontonagon River where they make their way to Lake Superior and continue to grow. When it is time for the fish to spawn, they return to the Ontonagon River watershed that was “imprinted” on them at birth. Lake sturgeon play a vital role in both riverine and lacustrine ecosystems, and these efforts help sustain their population.
Fish Planting
At UPPCO, we love fish, and we love fishing. Each year, we provide funds to local organizations for fisheries management and enhancements. The stocked fish range in size from 7 to 15 inches long. Every day, we operate each of our hydroelectric facilities in a manner that balances the needs of healthy fish and other aquatic species with the demand for renewable hydroelectric power.
Bond Falls Mitigation & Enhancement Fund
The Mitigation and Enhancement Fund (MEF) is a mechanism set up through the Bond Falls Settlement Agreement (BFSA) to fund habitat improvement projects and assessments in the Ontonagon River watershed. These guidelines are intended to provide background and guidance to applicants regarding the MEF goals, the annual application process, proposal format, contact information, eligibility, annual selection, reporting requirements, and fund disbursement. The Bond Falls Implementation Team (BFIT) is available as a resource to applicants and is responsible for the development and application of these guidelines and the selection of projects for funding. See below for the application, guidelines, and more information.
- 2026 Bond Falls MEF Grant Guidelines (PDF)
- MEF Project Example Mussel Survey of ONF (PDF)
- MEF Project Example Invasive Hockeysuckle Control (PDF)
- MEF Info Settlement Agreement Section 7 (PDF)
Average Fuel Mix Comparison
The information shown in the tables includes data for different time periods, due to the availability of such data. In making energy purchase decisions, you may find it more helpful to compare the fuel mix data of individual suppliers to that of other individual suppliers, rather than comparing the fuel mix of any 1 supplier to the regional fuel mix.
Percentage of Fuel Type Used to Produce Electricity
Percentage of Fuel Type Used to Produce Electricity
| Fuel type | Company Owned | Purchased | Regional Average* |
|---|---|---|---|
| Coal | 0% | 22% | 26% |
| Nuclear | 0% | 20% | 24% |
| Natural Gas | 0% | 30% | 36% |
| Oil | less than 1% | less than 1% | less than 1% |
| Hydroelectric | 15% | less than 1% | less than 1% |
| Renewable Fuels | 0% | 11% | 13% |
| Biofuel | 0% | less than 1% | less than 1% |
| Biomass | 0% | less than 1% | less than 1% |
| Solar | 0% | 3% | 3% |
| Solid Waste Incineration** | 0% | less than 1% | less than 1% |
| Wind | 0% | 7% | 8% |
| Wood | 0% | less than 1% | less than 1% |
* Regional Average: Michigan, Illinois, Indiana, Ohio, and Wisconsin
** Includes landfill gas
The figures above reflect the period of April 2025 through March 2026